
Your Logs Are Lying to You (And What to Do About It)
Logs Are a Code Smell (Sometimes)


When your logs say everything… and nothing.
Almost every developer has done it:
for (Order order : orders) {
    log.info("Processing order {}", order.getId());
    process(order);
}
It feels harmless when you have ten test orders on your laptop.
Push the same code to production - where there are two million orders an hour and suddenly:
Pods get evicted because log files fill the disk.
Your observability bill shoots past your coffee budget.
Real errors disappear under a waterfall of “Processing order…”.
This is what happens when we use logging as a substitute for design.
Logging isn’t the villain. Using it as duct-tape for deeper design problems is.
Below are four everyday logging mistakes (I’ve made every one of them), the pain they cause, and simple ways to turn the noise into real insight.
1. Hot-Loop Logging
for (User u : userList) {
    log.debug("User found: {}", u.getEmail());
    sendWelcomeMail(u);
}
Why it stings
CPU & I/O drain: Formatting strings and writing to disk thousands of times a second steals cycles from business logic.
Real-world fallout: One team I coached saw their Kubernetes node hit “DiskPressure” after 40 minutes of a bulk import - logs alone chewed 22 GB.
Debugging blindfold: When everything is logged, nothing stands out.
Fix in five minutes
int processed = 0;
long start = System.nanoTime();

for (User u : userList) {
    sendWelcomeMail(u);
    processed++;
}

log.info("Sent {} welcome mails in {} ms",
         processed,
         (System.nanoTime() - start)/1_000_000);
Log once, summarise, move on.
Need per-user data? Emit a metric (welcome_mail_total) and graph it, no human wants to read 100 000 log lines about it.
2. Boolean-Flag Noise
log.debug("isActive=" + user.isActive());Even when DEBUG is disabled, the JVM still builds that string. Repeat in a hot path and the garbage collector becomes your shadow.
Fix in five seconds
if (log.isDebugEnabled()) {
    log.debug("isActive={}", user.isActive());
}
The guard stops needless work.
The
{}placeholder defers formatting until the line is actually written.
3. Panic-Level Misuse
log.error("Invalid coupon code: {}", code);A user typo is annoying, not an outage, yet it pages the on-call engineer at midnight.
How to choose the right level
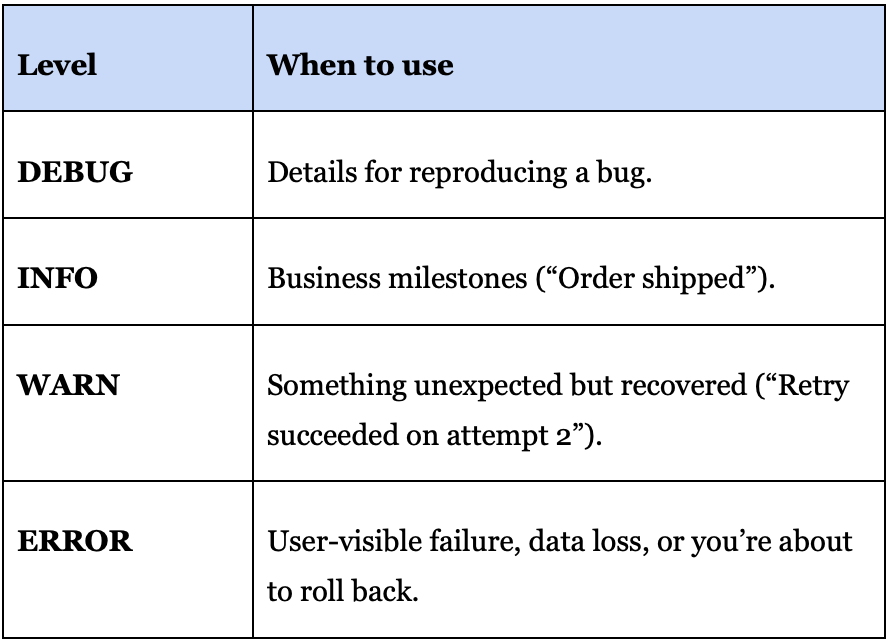
Route ERROR to PagerDuty, send WARN to a Slack channel, and let INFO live quietly in your log store.
4. “Printf Metrics”
long t0 = System.nanoTime();
// DB query…
log.info("query_ms={}", (System.nanoTime() - t0) / 1_000_000);
You later write a regex in Grafana to graph the numbers. One day someone changes the log text, the regex breaks, and alerts go silent.
Better: emit a real metric
Timer queryTimer = Metrics.timer("db.query.duration");
long t0 = System.nanoTime();

runQuery(sql);

queryTimer.record(System.nanoTime() - t0, TimeUnit.NANOSECONDS);
Percentiles, alerts, and dashboards stay intact no matter how the log message evolves.
Logs tell stories; metrics track numbers; traces show relationships. Keep the channels separate.
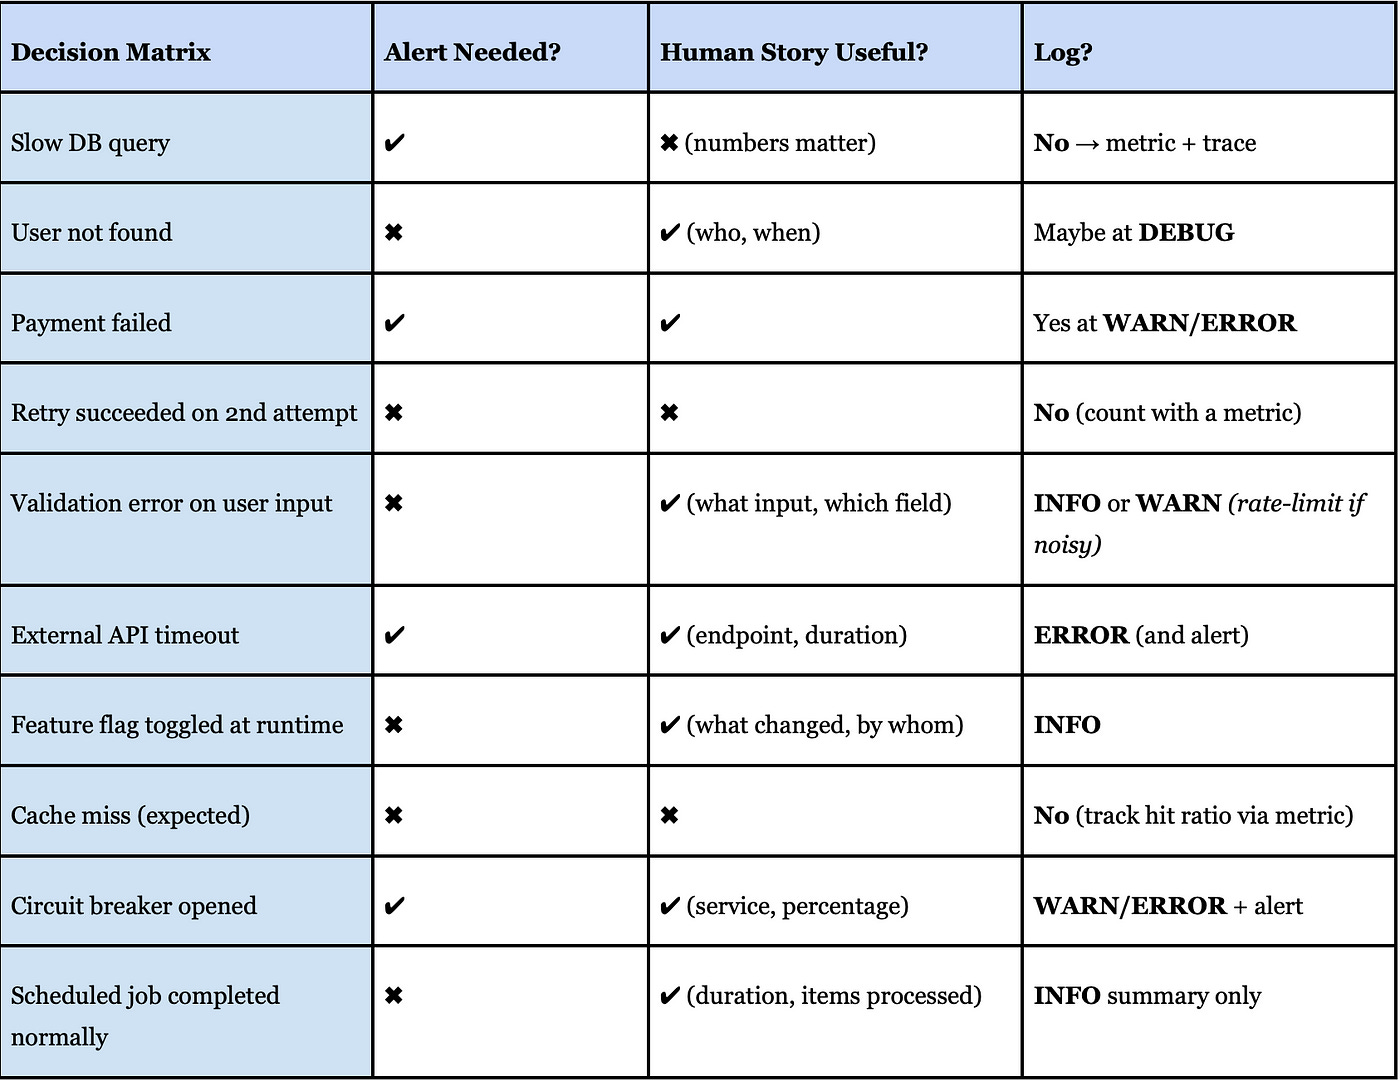
Choosing Not to Log
A Simple Logging Playbook You Can Adopt Tomorrow
Write a one-page team policy
Levels, PII rules, retention. Consistency beats “whatever the last person did”.Set a daily log budget
Choose a number (e.g., “1 GB per service per day”) and alert when you get close.Add request IDs automatically
With SLF4J’s MDC or Log4j ThreadContext. One-click correlation beats grep.Batch or sample in bulk jobs
Log the first record, every thousandth, and the last. Or just the summary.Review the top 10 chatty log statements every sprint
Deleting dead noise is the fastest performance win you’ll ever get.
Logging is like salt in cooking: essential, but easy to overdo. Whenever you add a line, ask yourself:
Who will read this and why?
Is there a cheaper/faster way to get the same insight?
Could this message become dangerous at scale?
Answer those three and you’ll log just enough and probably sleep better on-call.